Quickstart
hictkpy provides Python bindings for hictk through nanobind.
hictkpy.File can open .cool and .hic files and can be used to fetch interactions as well as file metadata.
The examples in this section use the file 4DNFIOTPSS3L.hic, which can be downloaded from the 4D Nucleome Data Portal here.
Opening files
In [1]: import hictkpy as htk

# .mcool and .cool files are also supported
In [2]: f = htk.File("4DNFIOTPSS3L.hic", 10_000)

In [3]: f.path()
Out[3]: '4DNFIOTPSS3L.hic'
Important
The above example assigns the hictkpy.File directly to variable f for simplicity.
Always prefer using context managers (e.g., the with keyword) when opening files using hictkpy:
with htk.File("4DNFIOTPSS3L.hic", 10_000) as f:
  # use the file
Reading file metadata
In [4]: f.resolution()
Out[4]: 10000

In [5]: f.chromosomes()
Out[5]:
{'2L': 23513712,
 '2R': 25286936,
 '3L': 28110227,
 '3R': 32079331,
 '4': 1348131,
 'X': 23542271,
 'Y': 3667352}

In [6]: f.attributes()
Out[6]:
{'bin_size': 10000,
 'format': 'HIC',
 'format_version': 8,
 'assembly': '/var/lib/cwl/stgb25a903a-ebb6-4a56-bf3f-90bd84a40bf4/4DNFIBEEN92C.chrom.sizes',
 'format-url': 'https://github.com/aidenlab/hic-format',
 'nbins': 13758,
 'nchroms': 7}
Fetch interactions
Interactions can be fetched by calling the hictkpy.File.fetch() method on hictkpy.File objects.
hictkpy.File.fetch() returns hictkpy.PixelSelector objects, which are very cheap to create.
# Fetch all interactions (genome-wide query) in COO format (row, column, count)
In [7]: sel = f.fetch()

# Fetch all interactions (genome-wide query) in bedgraph2 format
In [8]: sel = f.fetch(join=True)

# Fetch KR-normalized interactions
In [9]: sel = f.fetch(normalization="KR")

# Fetch interactions for a region of interest
In [10]: sel = f.fetch("2L:10,000,000-20,000,000")

In [11]: sel = f.fetch("2L:10,000,000-20,000,000", "X")

In [12]: sel.nnz()
Out[12]: 2247057

In [13]: sel.sum()
Out[13]: 7163361
Fetching interactions as pandas DataFrames
In [13]: sel = f.fetch("2L:10,000,000-20,000,000", join=True)

In [14]: sel.to_df()
Out[14]:
       chrom1    start1      end1 chrom2    start2      end2  count
0          2L  10000000  10010000     2L  10000000  10010000   6759
1          2L  10000000  10010000     2L  10010000  10020000   3241
2          2L  10000000  10010000     2L  10020000  10030000    760
3          2L  10000000  10010000     2L  10030000  10040000    454
4          2L  10000000  10010000     2L  10040000  10050000    289
...       ...       ...       ...    ...       ...       ...    ...
339036     2L  19970000  19980000     2L  19980000  19990000    407
339037     2L  19970000  19980000     2L  19990000  20000000    221
339038     2L  19980000  19990000     2L  19980000  19990000    391
339039     2L  19980000  19990000     2L  19990000  20000000    252
339040     2L  19990000  20000000     2L  19990000  20000000    266

[339041 rows x 7 columns]
Fetching interactions as scipy.sparse.csr_matrix
In [15]: sel = f.fetch("2L:10,000,000-20,000,000")

In [16]: sel.to_csr()
Out[16]:
<Compressed Sparse Row sparse matrix of dtype 'int32'
        with 339041 stored elements and shape (1000, 1000)>
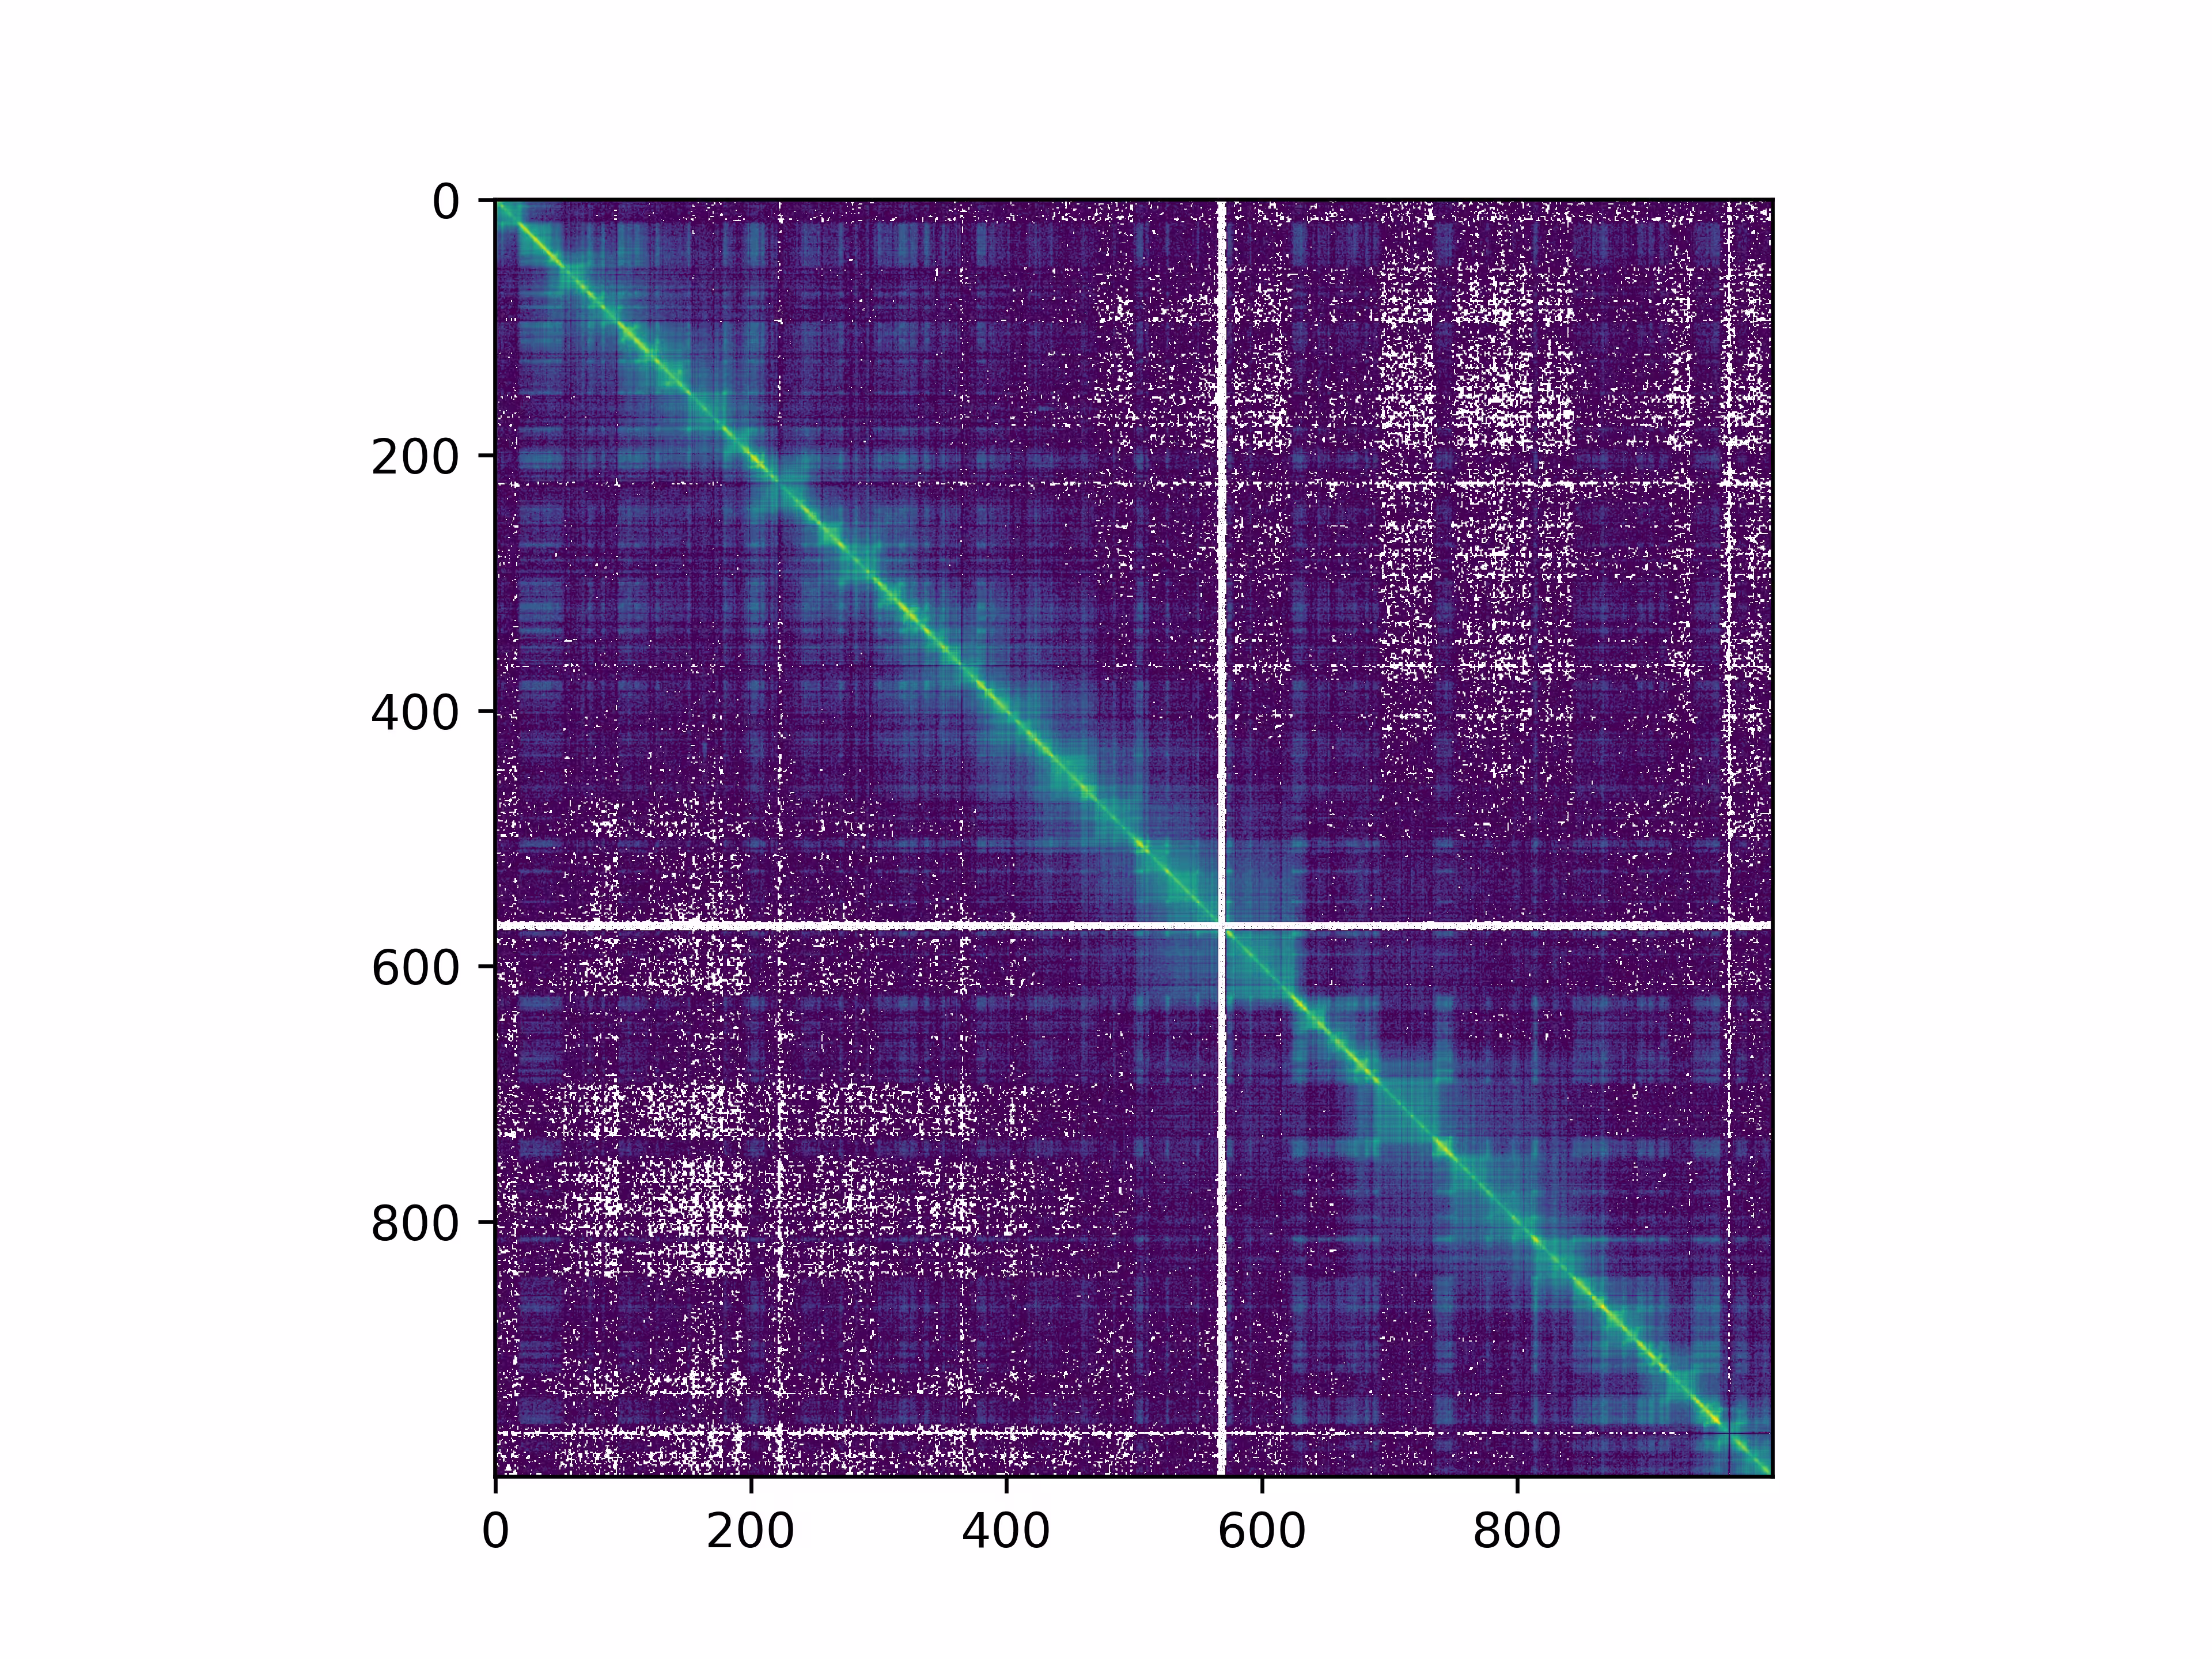
Fetching interactions as numpy NDArray
In [17]: sel = f.fetch("2L:10,000,000-20,000,000")

In [18]: m = sel.to_numpy()

In [19]: import matplotlib.pyplot as plt

In [20]: from matplotlib.colors import LogNorm

In [21]: plt.imshow(m, norm=LogNorm())

In [22]: plt.show()
Fetching other types of data
Fetching the table of bins as pandas.DataFrame:
In [23]: f.bins()
Out[23]:
      chrom    start      end
0        2L        0    10000
1        2L    10000    20000
2        2L    20000    30000
3        2L    30000    40000
4        2L    40000    50000
...     ...      ...      ...
13753     Y  3620000  3630000
13754     Y  3630000  3640000
13755     Y  3640000  3650000
13756     Y  3650000  3660000
13757     Y  3660000  3667352

[13758 rows x 3 columns]
Fetching balancing weights:
In [24]: import pandas as pd

In [25]: weights = {}
    ...: for norm in f.avail_normalizations():
    ...:     weights[norm] = f.weights(norm)
    ...: weights = pd.DataFrame(weights)
    ...: weights
Out[25]:
             KR        VC   VC_SQRT
0      0.582102  0.666016  0.759389
1      1.300415  1.496604  1.138349
2      1.180977  1.470464  1.128364
3      1.007625  1.266340  1.047122
4      1.175642  1.492664  1.136850
...         ...       ...       ...
13753       NaN  0.000000  0.000000
13754       NaN  0.000000  0.000000
13755       NaN  0.000000  0.000000
13756  1.155544  2.234906  0.631055
13757       NaN  0.069841  0.111556

[13758 rows x 3 columns]
Efficiently compute descriptive statistics
hictkpy supports computing common descriptive statistics without reading interactions into memory (and without traversing the data more than once).
Compute all supported statistics at once:
In [26]: f.fetch().describe()
Out[26]:
{'nnz': 18122793,
 'sum': 114355295,
 'min': 1,
 'max': 53908,
 'mean': 6.310025998751958,
 'variance': 9918.666837525623,
 'skewness': 83.28386530442891,
 'kurtosis': 20043.612488253475}
For more details, please refer to the Statistics section of the API docs for the hictkpy.PixelSelector class.